HydroOffice Tools

Generation #3

The newest generation of general-purpose tools for data processing - import from variable types of sources, data cleaning, data wrangling and data visualization. This group also lists three add-ins that extends options of MS Excel usability in the field of data science and spatial data processing.

Stagraph

Stagraph is a professional tool for visual data exploration and statistical graphics. This tool brings professional data science functions and features in a very simple visual interface. Without coding or scripting you can load data from practically any data source and process them - wrangle and visualize. Created results you can export in various forms - raster and vector graphics or you can export your work in the form of R code that can be used outside the application.

Reshape.XL

This tool forms a MS Excel add-in that exceptionally extends Excel options in the field of data wrangling, data cleaning, data reshaping, data grouping and data summarizing. With this tool you are able to make very complicated data processing very simply and quickly. Tasks that takes hours you can do with this tool in minutes. Technically is add-in strongly inspired by up-to-date data science packages - R and SQL language.

GIS.XL

Do you need to create shapefile from your Excel spreadsheet data? Do you want to display your spreadsheet data on map? Or you want to combine Excel data with shapefiles? This tool brings full featured GIS application into the MS Excel environment. Combine the powerful features of Excel and GIS inside one window. Processing spatial data in Excel was never so easy.

Map.XL

Simple to use Excel add-in for spreadsheet point data visualization on the map. Your data you can display on map background from various online providers (e.g. Google Maps, Satellite Maps, ESRI maps or Open Street Maps). Choose the map provider, select data in the spreadsheet and display them. Small, simple and free Excel add-in for online Maps.

Generation #2

Professional tools for geosciences. List of tools where each is specialized on selected area of interest, such as hydrological and meteorological time-series data processing, well log plotting, 2D / 3D geological visualization and geochemical diagrams plotting.

TS Editor

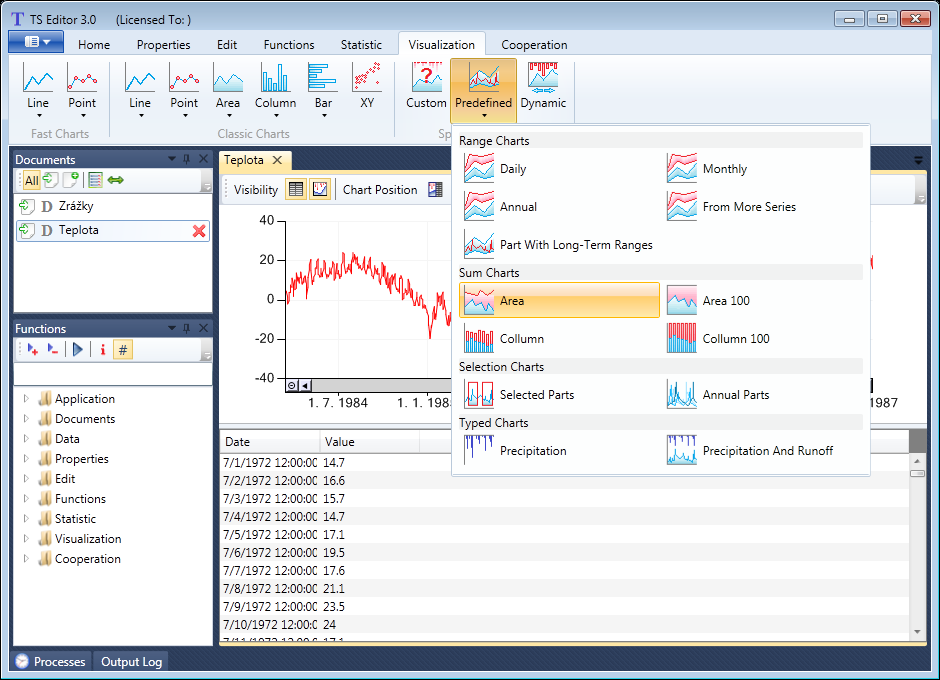
Software for hydrological and meteorological time-series data processing. The program contains numerous functions for time series analysis, editing, statistics and visualization. In the case, you are working as geo-scientist or environmental engineer, this tool can save you large amount of time.

Well Plotter

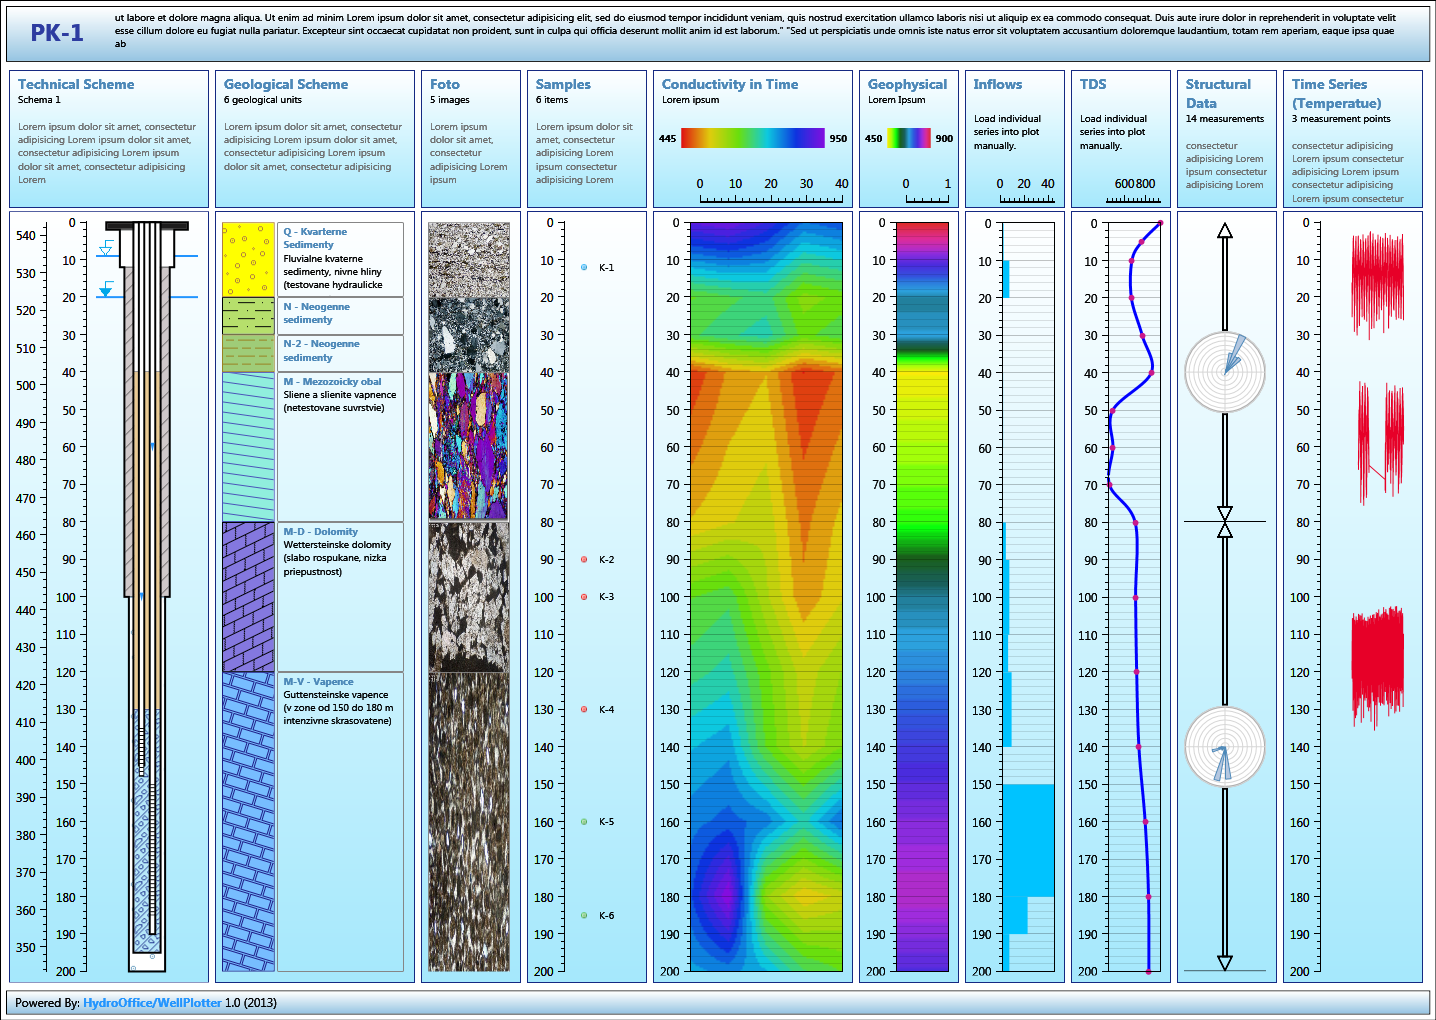
Wells and boreholes data visualization software for individuals. Display borehole technical and geological schemes, numerical point / continuous measurements, position of samples in vertical profile, tectonic and structural data or rock images. All described data can be simultaneously displayed in one Log Plot.

Well Plotter 3D

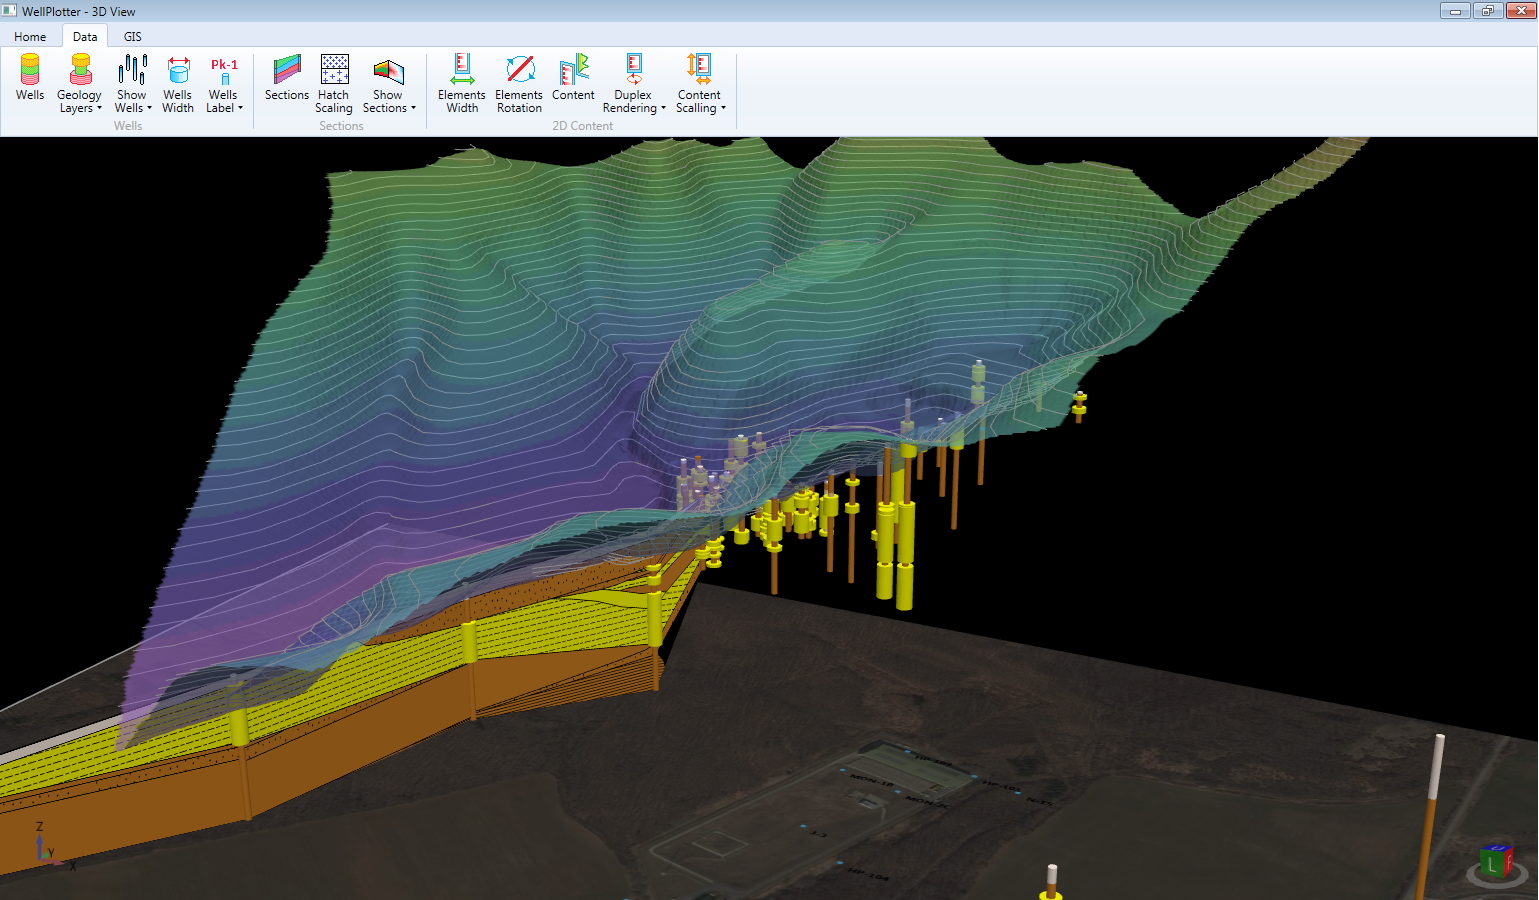
3D version includes all the function and features of the basic Well Plotter tool. Except that includes also functions for creating and rendering 2D cross sections and 3D fence diagrams. Well Plotter 3D is the simplest tool for analysing geological data in 3D space.

Piper

Geochemical data analysis in Piper diagram. Comprehensive tool for creating professional Piper diagram. The program is based on vector graphic rendering and you can visually edit and adjust all the properties. Piper diagrams you can display in two modes - basic Piper diagram and also its extended version.

Durov

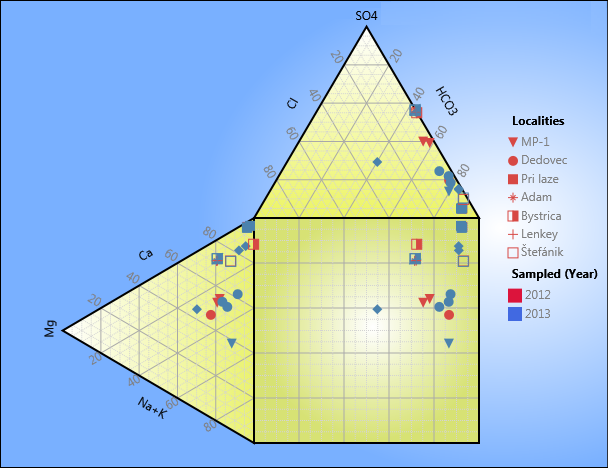
Plot your geochemical data in Durov diagram. Comprehensive tool for creating a professional Durov diagram. The program is based on vector graphic rendering and you can visually edit and adjust all the properties. Durov diagram can be displayed in three modes - basic Durov diagram and two extended version.

Ternary

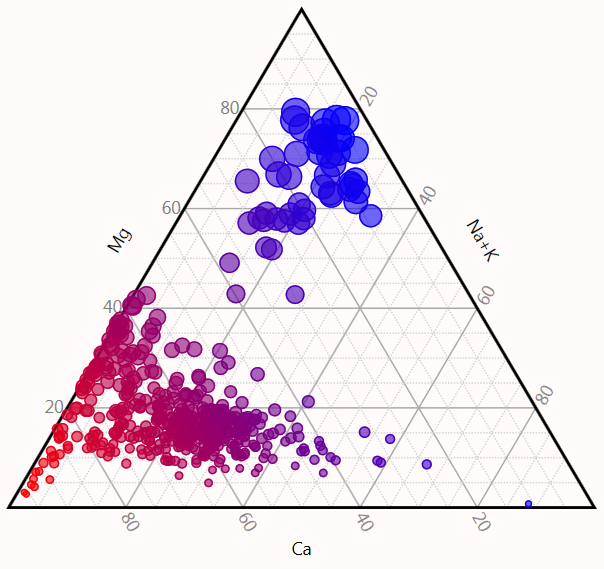
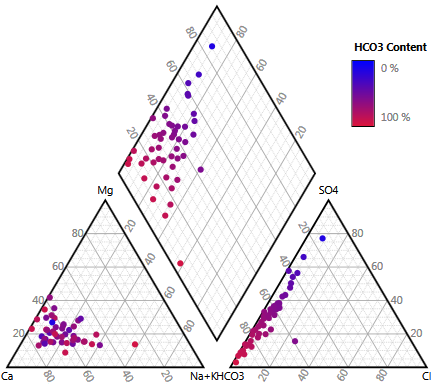
Free software tool for creating interactive Ternary diagram. The program is based on vector graphic rendering and you can visually edit and adjust all the properties. Interesting features such as conditional setup of points rendering, vector zoom, direct text editing.

Generation #1

The oldest generation of HydroOffice tools. Each tool is focused on specialized area of interest in the field of Hydrology and Hydrogeology such as recession curves analysis or baseflow separation. All the tools from this group are licensed as freeware.

BFI+

Software for baseflow separation from a hydrogram. The program includes a choice of 11 methods for separation. It includes methods such as local minimum, fixed interval or sliding interval methods; and also methods of recursive digital filters. BFI+ currently forms standard for baseflow separation.

RC

Unique tool for recession curves analysis. The program allows you to quickly separate individual recession curves from a hydrograph, and then analyze the individual recession curves or the master recession curve.

FDC

A tool for flow duration curves calculating and rendering. FDC curves are often used in the assessment of hydrological drought. Flow duration curves can be created from the entire imported time series or from defined parts, such as annual or monthly segments.

FlowComp

FlowComp is an interesting tool if you want to separate multiple runoff components from a hydrograph. It uses a relatively little known method of separation based on the result of recession curves analysis.

Kille

Very simple tool which allows you to calculate the long-term average groundwater runoff from 10-year series of daily river discharges.

TLM

This tool is designed to assess hydrological drought and flood events. Threshold level or sequence peak algorithm methods can be used to evaluate extreme conditions.

AMn

The oldest and simplest of all HydroOffice tools. The program allows you to calculate the minimum and maximum N-daily values in individual years.

Custom Development

In special cases I offer an option of custom development.

Read More